TriNetX has become an integral tool for conducting clinical research at the University of Iowa. TriNetX allows our users to collaborate, enhance their study design, accelerate the patient recruitment process, and bring new therapies to market faster.
To honor our most frequent users, we have awarded certificates to four individuals with the most queries from each of the three categories of users: faculty, staff, and students. Learn how these users are utilizing TriNetX to make their research more accurate and to accelerate their findings.
 Jeri Sieren, RN
I typically query TriNetX for NeuroNEXT feasibility surveys, but have also used TriNetX to search for a specific patient population.
 Jake Michaelson, PhD
Describe your research project.
The project was to see if we could find clinical evidence to support or refute a differential relationship between high/low thyroxine levels and bipolar disorder and language impairment. We had observed suggestive evidence of such a connection in our genomic data, and examination of over 100,000 individuals with thyroxine levels confirmed this.
What were you using the queries for?
The queries were used as an additional line of evidence in an ongoing study.
How has TriNetX helped your research?
We have used TriNetX in two main contexts: 1) to find independent evidence to support or refute hypotheses that we generate using our genomic data and 2) as a part of study planning to see whether our local patient population could support the research studies we are contemplating.
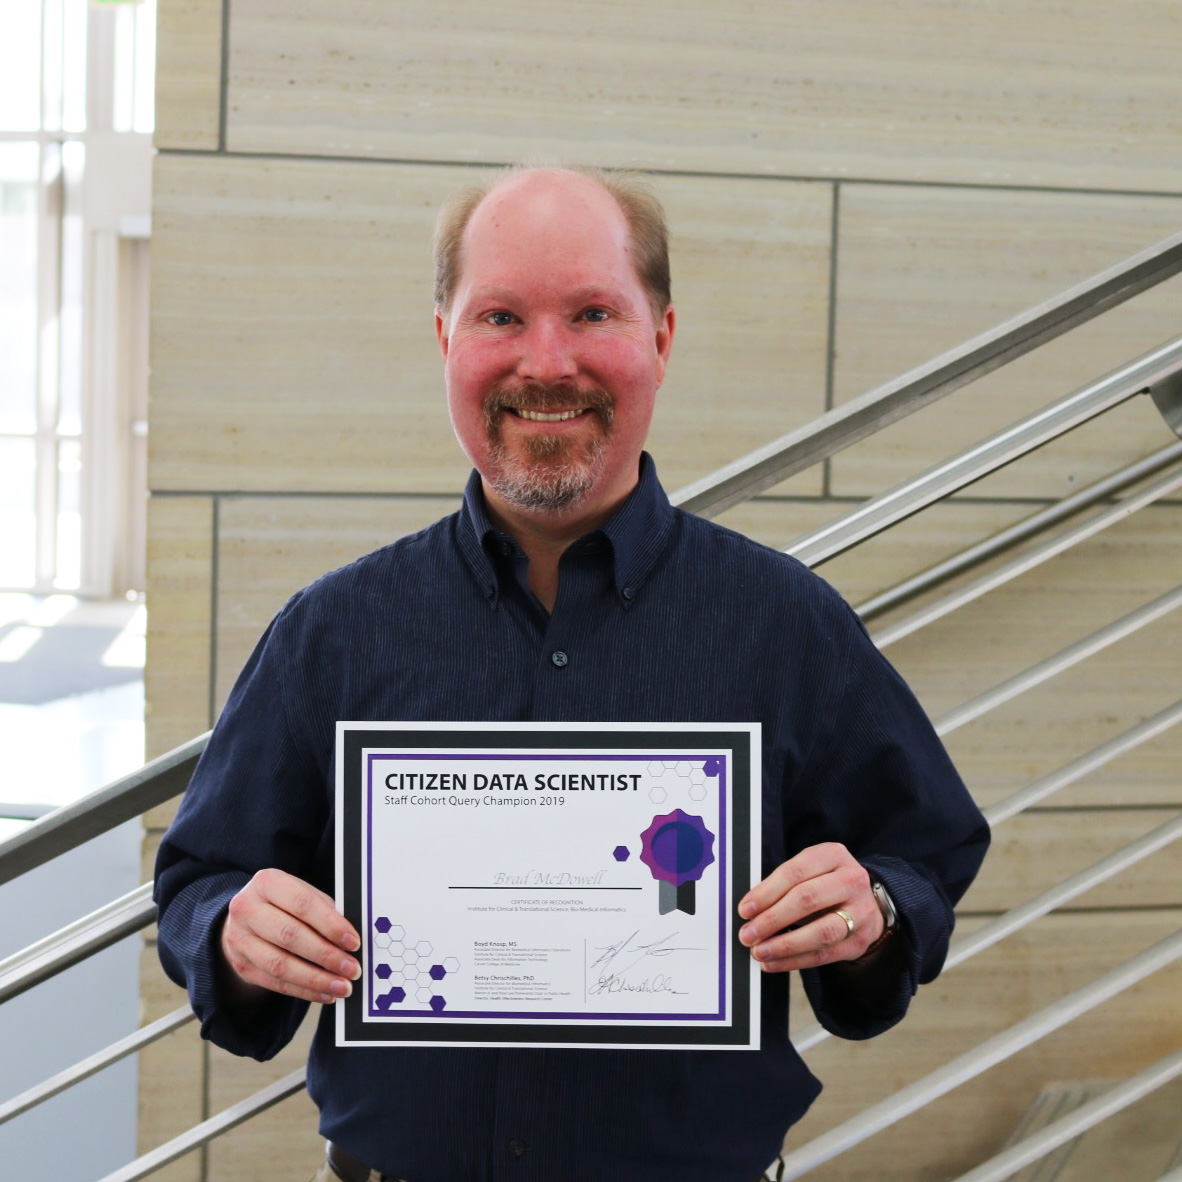
 Brad McDowell
The queries I’ve written span several potential research projects, all relating in some way to cancer. I think most of the queries were to examine project feasibility, although some were done to learn more about TriNetX itself.
 Roshan Abid
Describe your research project.
My research project explores the association between drugs that dilate blood vessels and the incidence of rosacea in these patients. Rosacea is a medical condition defined by constant redness and visible blood vessels in the skin. Frequent and/or intense flushing of the skin is known to play a role in the causes of rosacea. Though a common side effect of antihypertensive medications includes flushing, as some function by dilating blood vessels, to date the association between the effects of antihypertensive medications on peripheral vessels and rosacea is not well understood. We used TriNetX to conduct a retrospective cohort study of patients seen at University of Iowa Hospitals & Clinics with a diagnosis of hypertension and/or a diagnosis of rosacea to further explore this relationship. We compared sample sizes of patients with/without hypertension treated with vasodilator medications and with/without rosacea to calculate relative risks. In addition to the diagnoses, we intend to analyze demographic variables, such as gender, age, weight, alcohol use, and smoking history to explore possible confounding or effect-modifying variables.
What were you using queries for?
These queries were used to complete an abstract for the American Academy of Dermatology's 2020 National Meeting. We hope to request more data from the TriNetX database regarding our samples to put a poster together t present at the national meeting in March.
How has TriNetX helped your search?
TriNetX is an incredible tool that pools together ICD-10 coded medical data from UIHC and allows users to analyze the data for trends/associations in a straightforward and easy fashion. TriNetX's user-friendly interface allowed me to narrow my search so that I could make sure each patient started the vasodilator medication prior to developing rosacea, which is an integral time-sensitive part needed to support our hypothesis. TriNetX also allowed me to toggle between different time relationships, to analyze if there was an increasing effect over time (i.e. did the incidence of patients developing rosacea increase 1 year after starting the drug, 2 year, 3 year, etc.). The multitude of functions and easy-to-use site made it much easier to identify and explore different correlations between variables.